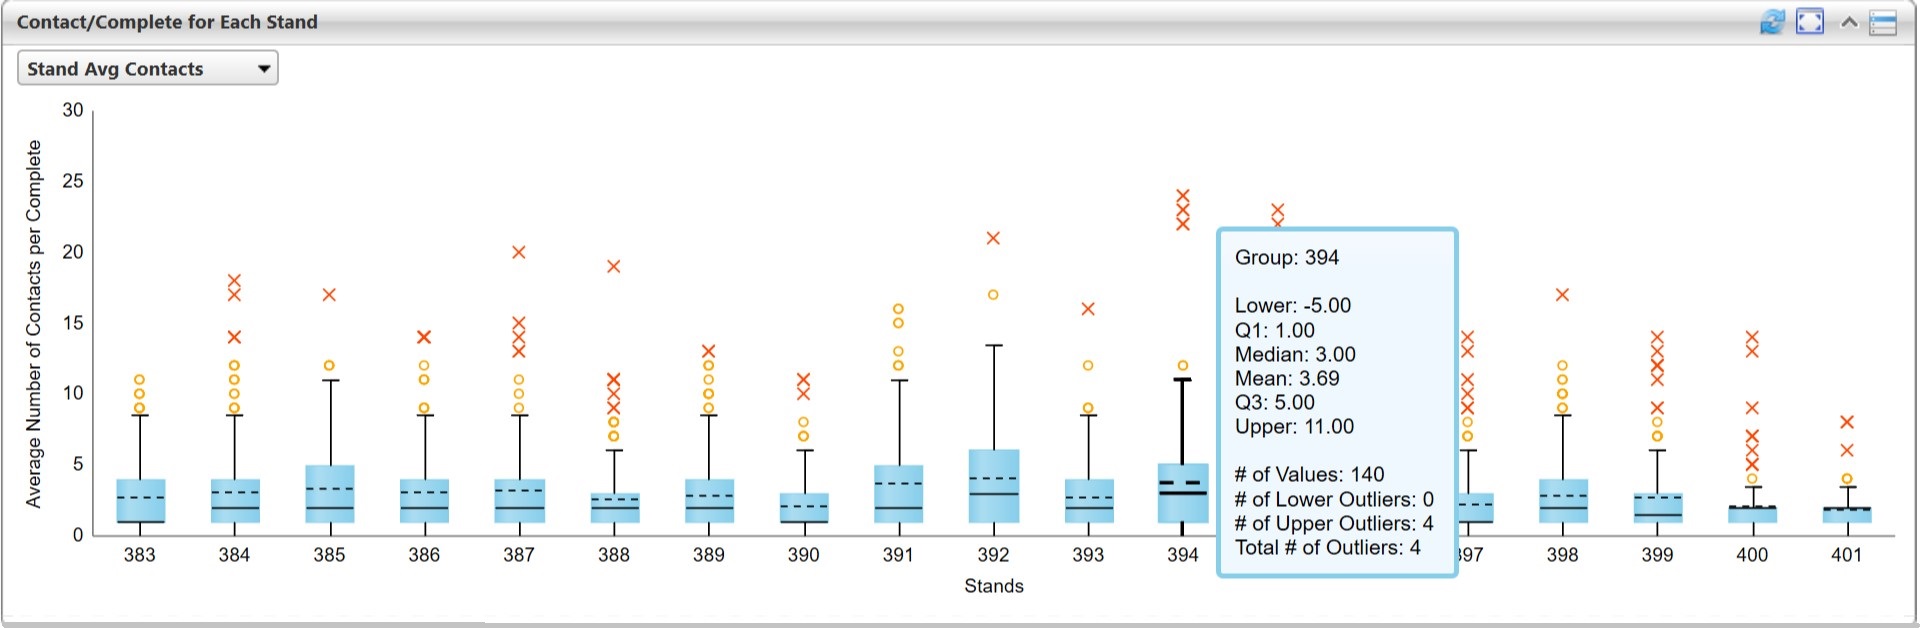
Data points can be analyzed using the box plot portlet to determine normal values and identify outlier cases. In this example, we analyzed how many contacts it was taking each stand (field period). Outlier data is determined statistically by identifying the median point and calculating the top and bottom 25% from the median. These plots are easy ways to determine cases outside of the norm and can show how the average may be skewed away from the median.
The data download function will show the anomalous cases.
Portlet Main Image
Challenge Addressed
How does your study identify anomalous data?
Audience
Portlet Family