This portlet will help to identify the best and worst hours of each day of the week to successfully complete a task. This analysis helps the study to target the hours that tend to get the most completes and the fewest refusals, and to avoid the hours that tend to get more refusals than completes.
Portlet Main Image
Portlet Long Description
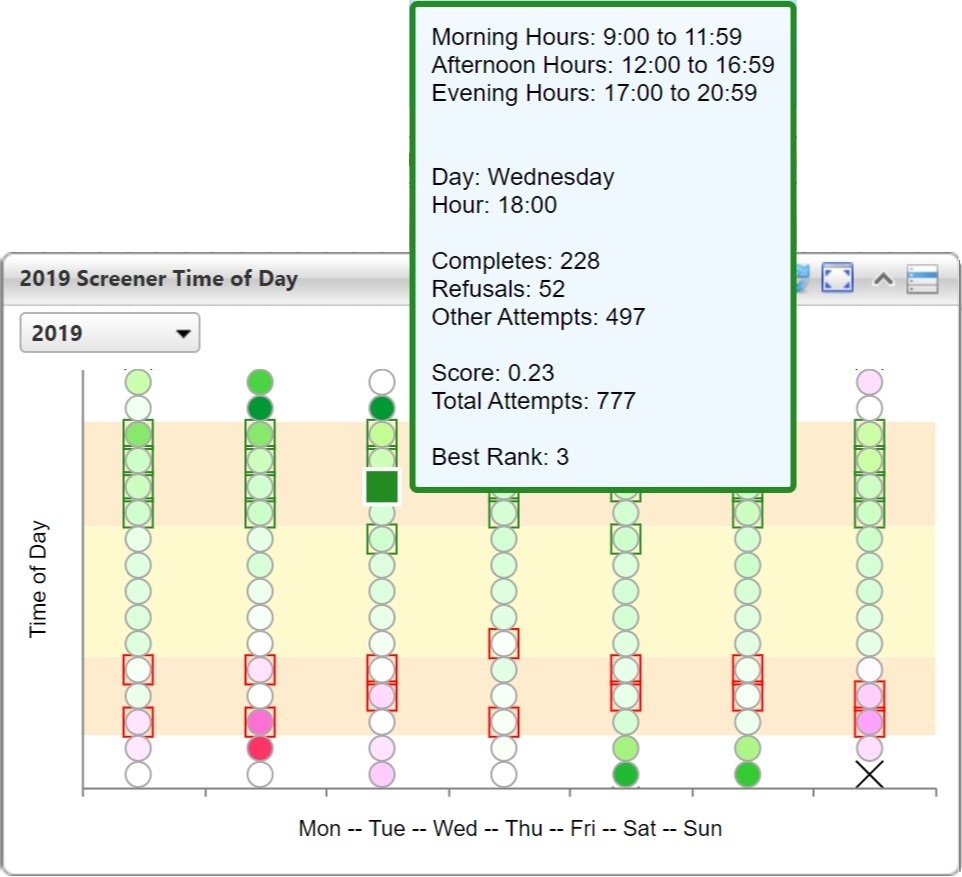
This shows a heat map going from the worst (the darkest red) to the best (the darkest green) for each business hour of the day for each day of the week. The best four hours for each day are highlighted with green squares, and the worst two hours of each day are highlighted with red squares.
Challenge Addressed
How do you determine the best and worst hours of the data to make contacts?
Audience
Portlet Family
Portlet Iterations