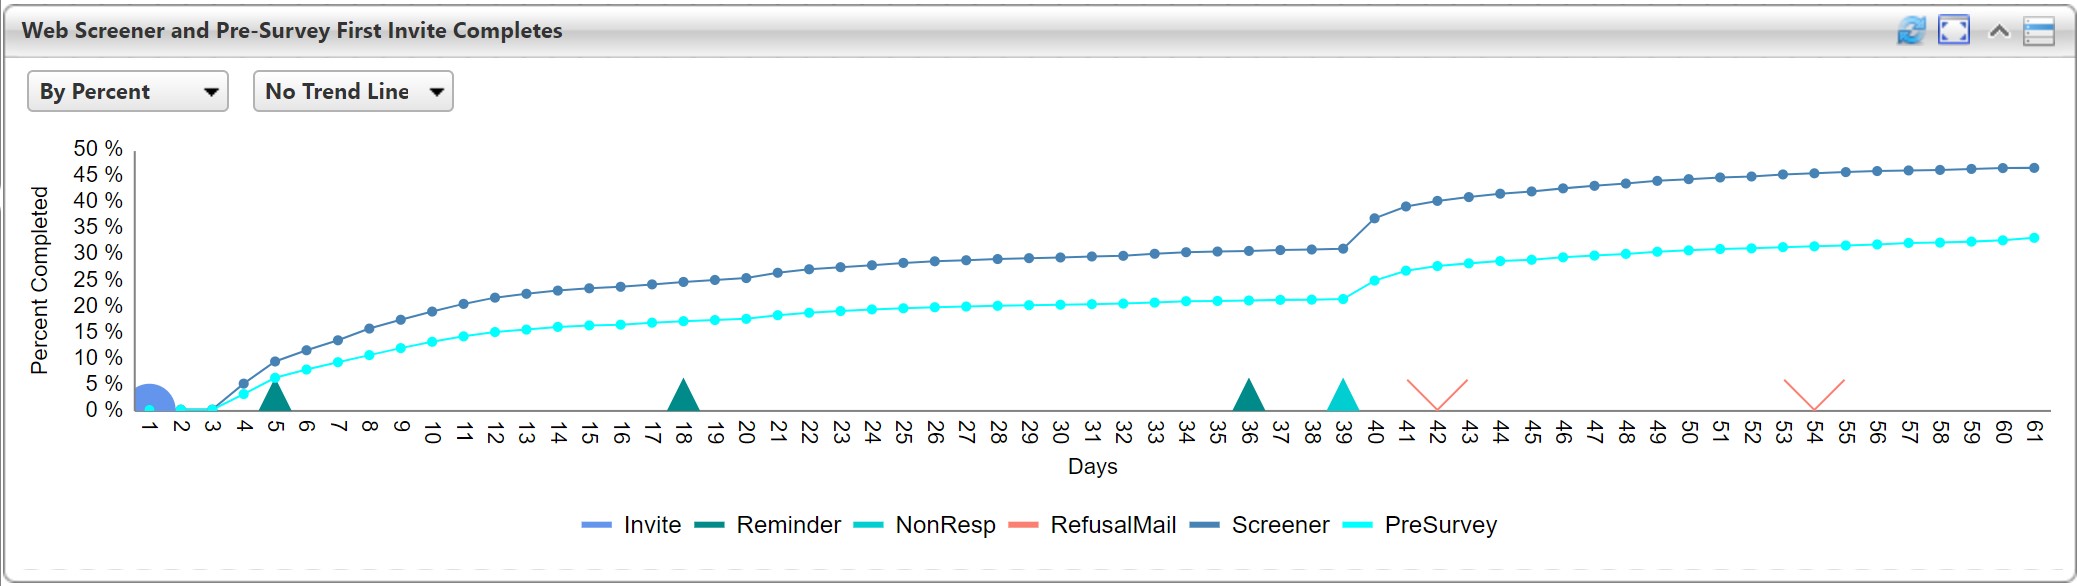
This portlet shows day by day of the protocol the cumulative completion counts and the effectiveness of each communication.
In this example, the cases flowed into the protocol on different calendar dates. The case communications were aligned such that they all start at day zero. Most of the interventions saw a small uptick in completions, but are barely visible. The day 39 communication was a FedEx package with an incentive. This showed the largest uptick.
This portlet comes with a trendline overlay that will show the upticks, down turns and the leveling off of completions.
Portlet Main Image
Challenge Addressed
How can a study determine the protocol interventions (communications) that had affected response rates over the course of the study?
Audience
Portlet Family
Portlet Iterations